Compressing Images with K-Means Clustering
May 24, 2026 (3 days ago)
The internet is flooded with content every day. As of today, approximately 402 million terabytes of data are created each day. That number is almost impossible to picture, so imagine this: every second, the world produces the equivalent of over 70 years of 4K video.
That is why compression matters: instead of storing every detail exactly as it was captured, we look for ways to represent the same information using less space. Images are one of the media types that can be compressed, and in this post I'll explain one simple method to do so.
Compression by Reducing the Palette
There are many ways to compress images, but they usually fall into two categories: lossless and lossy.
Lossless compression preserves the original image exactly, but the file-size reduction is usually smaller. It finds repeating patterns and stores the data more efficiently. Lossy compression can shrink the file much more by discarding some information while trying to keep the image looking close to the original.
We will focus on a lossy method that shrinks the color palette of an image, replacing multiple similar colors with a single representative one, a technique called color quantization.
Pixels Are Just Numbers
Images are 2D arrays of pixels. Each pixel is one color, and each color is stored as three numbers: red, green, and blue.
Every square on the grid is one sampled pixel. Typical images use RGB, with 8 bits per channel.
R = 8 bits, G = 8 bits, B = 8 bits
So one pixel is
3 × 8 = 24 bits = 3 bytes
That is often called 24-bit color, true color, or sometimes PNG-24. If the image has transparency, we would need to add another 8-bit channel, turning it into PNG-32 with RGBA (RGB-alpha) color space.
If we wanted to save space, we could lower the data needed to represent one pixel. If we used only 256 colors, then every pixel would take 8 bits and store an index into that palette. So instead of pixel = (124, 81, 203), we would store pixel = 17, which translates to 17 -> (124, 81, 203). That format is called PNG-8 or indexed color.
As you can see, now instead of using 3 bytes, we only use 1, thus cutting our raw pixel data to one-third. We could go even further and use a 16-color palette, reducing the original size by a factor of 6, or a 4-color one that would reduce it by a factor of 12. You can do the math!
The K-Means Algorithm
Before applying this to images, let's understand the algorithm first.
K-Means is an unsupervised learning algorithm used for clustering. It groups unlabeled data points into k clusters, where points with similar values end up in the same group.
Let's ignore images for a second and imagine a set of 2D data points (x, y).
Let's imagine that we have a set of 2D data points. Each point has an x and y value.
From Points to Colors
The 2D demo used points like [x, y], but K-Means only cares about lists of numbers.
A pixel color is also a point, just in three dimensions. In code, I represent one RGB color as a tuple:
type Rgb = [number, number, number];

const pixel: Rgb = [231, 86, 42];
So instead of clustering positions like [x, y], we cluster colors like [red, green, blue].
Finding the Nearest Color
When assigning a pixel to a centroid, we need to know which centroid is closest. For that, we use squared Euclidean distance. We can skip the square root because it does not change which distance is smallest.
function squaredRgbDistance(a: Rgb, b: Rgb) {
  return (a[0] - b[0]) ** 2 + (a[1] - b[1]) ** 2 + (a[2] - b[2]) ** 2;
}
Then for each pixel we check every centroid and remember the index of the closest one:
for (let pixelIndex = 0; pixelIndex < pixels.length; pixelIndex++) {
  const pixel = pixels[pixelIndex];
  let bestCentroidIndex = 0;
  let bestDistance = Infinity;

  for (let centroidIndex = 0; centroidIndex < centroids.length; centroidIndex++) {
    const distance = squaredRgbDistance(pixel, centroids[centroidIndex]);

    if (distance < bestDistance) {
      bestDistance = distance;
      bestCentroidIndex = centroidIndex;
    }
  }

  assignments[pixelIndex] = bestCentroidIndex;
}
Moving Centroids
After every pixel has its closest centroid, we move each centroid to the average color of all pixels assigned to it. I use running totals for this because every pixel already knows which centroid it belongs to.
const sums: Rgb[] = Array.from({ length: k }, () => [0, 0, 0]);
const counts: number[] = Array.from({ length: k }, () => 0);

for (let pixelIndex = 0; pixelIndex < pixels.length; pixelIndex++) {
  const pixel = pixels[pixelIndex];
  const centroidIndex = assignments[pixelIndex];

  sums[centroidIndex][0] += pixel[0];
  sums[centroidIndex][1] += pixel[1];
  sums[centroidIndex][2] += pixel[2];
  counts[centroidIndex]++;
}
Applying It to Images
Now we can run the same assignment-and-averaging loop on all sampled pixels from the image. The final centroids become the reduced color palette, and each pixel is replaced by its closest palette color.
What This Leaves Out
K-Means is not how most production image formats choose palettes, but it is a great way to understand the core idea: many similar colors can be represented by fewer representative ones.
Real compressors also care about speed, file format details, perceptual color spaces, dithering, and how the final palette is stored. Those details matter, but they are separate from the main idea shown here.
The important takeaway is simple: once pixels are numbers, compression can become a clustering problem.
Final Implementation
Here is the complete algorithm used by the demo.
type Rgb = [number, number, number];

interface KMeansImageInput {
  pixels: Rgb[];
  k: number;
  maxIterations: number;
}

interface KMeansImageResult {
  palette: Rgb[];
  indexedPixels: number[];
  iterations: number;
}

function squaredRgbDistance(a: Rgb, b: Rgb) {
  return (a[0] - b[0]) ** 2 + (a[1] - b[1]) ** 2 + (a[2] - b[2]) ** 2;
}

function randomPixel(pixels: Rgb[]) {
  return [...pixels[Math.floor(Math.random() * pixels.length)]] as Rgb;
}

function compressImageColors({ pixels, k, maxIterations }: KMeansImageInput): KMeansImageResult {
  let totalIters = 0;

  const centroids: Rgb[] = [];
  const assignments: number[] = new Array(pixels.length).fill(0);

  // 1. Initialize centroids from random pixels in the image.
  for (let i = 0; i < k; i++) {
    centroids[i] = randomPixel(pixels);
  }

  for (let iters = 0; iters < maxIterations; iters++) {
    totalIters++;
    const previousCentroids = centroids.map((centroid) => [...centroid] as Rgb);

    // 2. Assign each pixel to the nearest centroid.
    for (let pixelIndex = 0; pixelIndex < pixels.length; pixelIndex++) {
      const pixel = pixels[pixelIndex];
      let bestCentroidIndex = 0;
      let bestDistance = Infinity;

      for (let centroidIndex = 0; centroidIndex < centroids.length; centroidIndex++) {
        const centroid = centroids[centroidIndex];
        const distance = squaredRgbDistance(pixel, centroid);

        if (distance < bestDistance) {
          bestDistance = distance;
          bestCentroidIndex = centroidIndex;
        }
      }

      assignments[pixelIndex] = bestCentroidIndex;
    }

    // 3. Move each centroid to the average RGB value of assigned pixels.
    const sums: Rgb[] = Array.from({ length: k }, () => [0, 0, 0]);
    const counts: number[] = Array.from({ length: k }, () => 0);

    for (let pixelIndex = 0; pixelIndex < pixels.length; pixelIndex++) {
      const pixel = pixels[pixelIndex];
      const centroidIndex = assignments[pixelIndex];

      sums[centroidIndex][0] += pixel[0];
      sums[centroidIndex][1] += pixel[1];
      sums[centroidIndex][2] += pixel[2];
      counts[centroidIndex]++;
    }

    for (let centroidIndex = 0; centroidIndex < k; centroidIndex++) {
      if (counts[centroidIndex] === 0) {
        centroids[centroidIndex] = randomPixel(pixels);
        continue;
      }

      centroids[centroidIndex] = [
        sums[centroidIndex][0] / counts[centroidIndex],
        sums[centroidIndex][1] / counts[centroidIndex],
        sums[centroidIndex][2] / counts[centroidIndex],
      ];
    }

    // 4. Stop early if centroids barely moved.
    const movedDistance = centroids.reduce((sum, centroid, index) => {
      return sum + squaredRgbDistance(centroid, previousCentroids[index]);
    }, 0);

    if (movedDistance < 1) {
      break;
    }
  }

  return {
    palette: centroids.map(([r, g, b]) => [Math.round(r), Math.round(g), Math.round(b)]),
    indexedPixels: assignments,
    iterations: totalIters,
  };
}
Acknowledgements
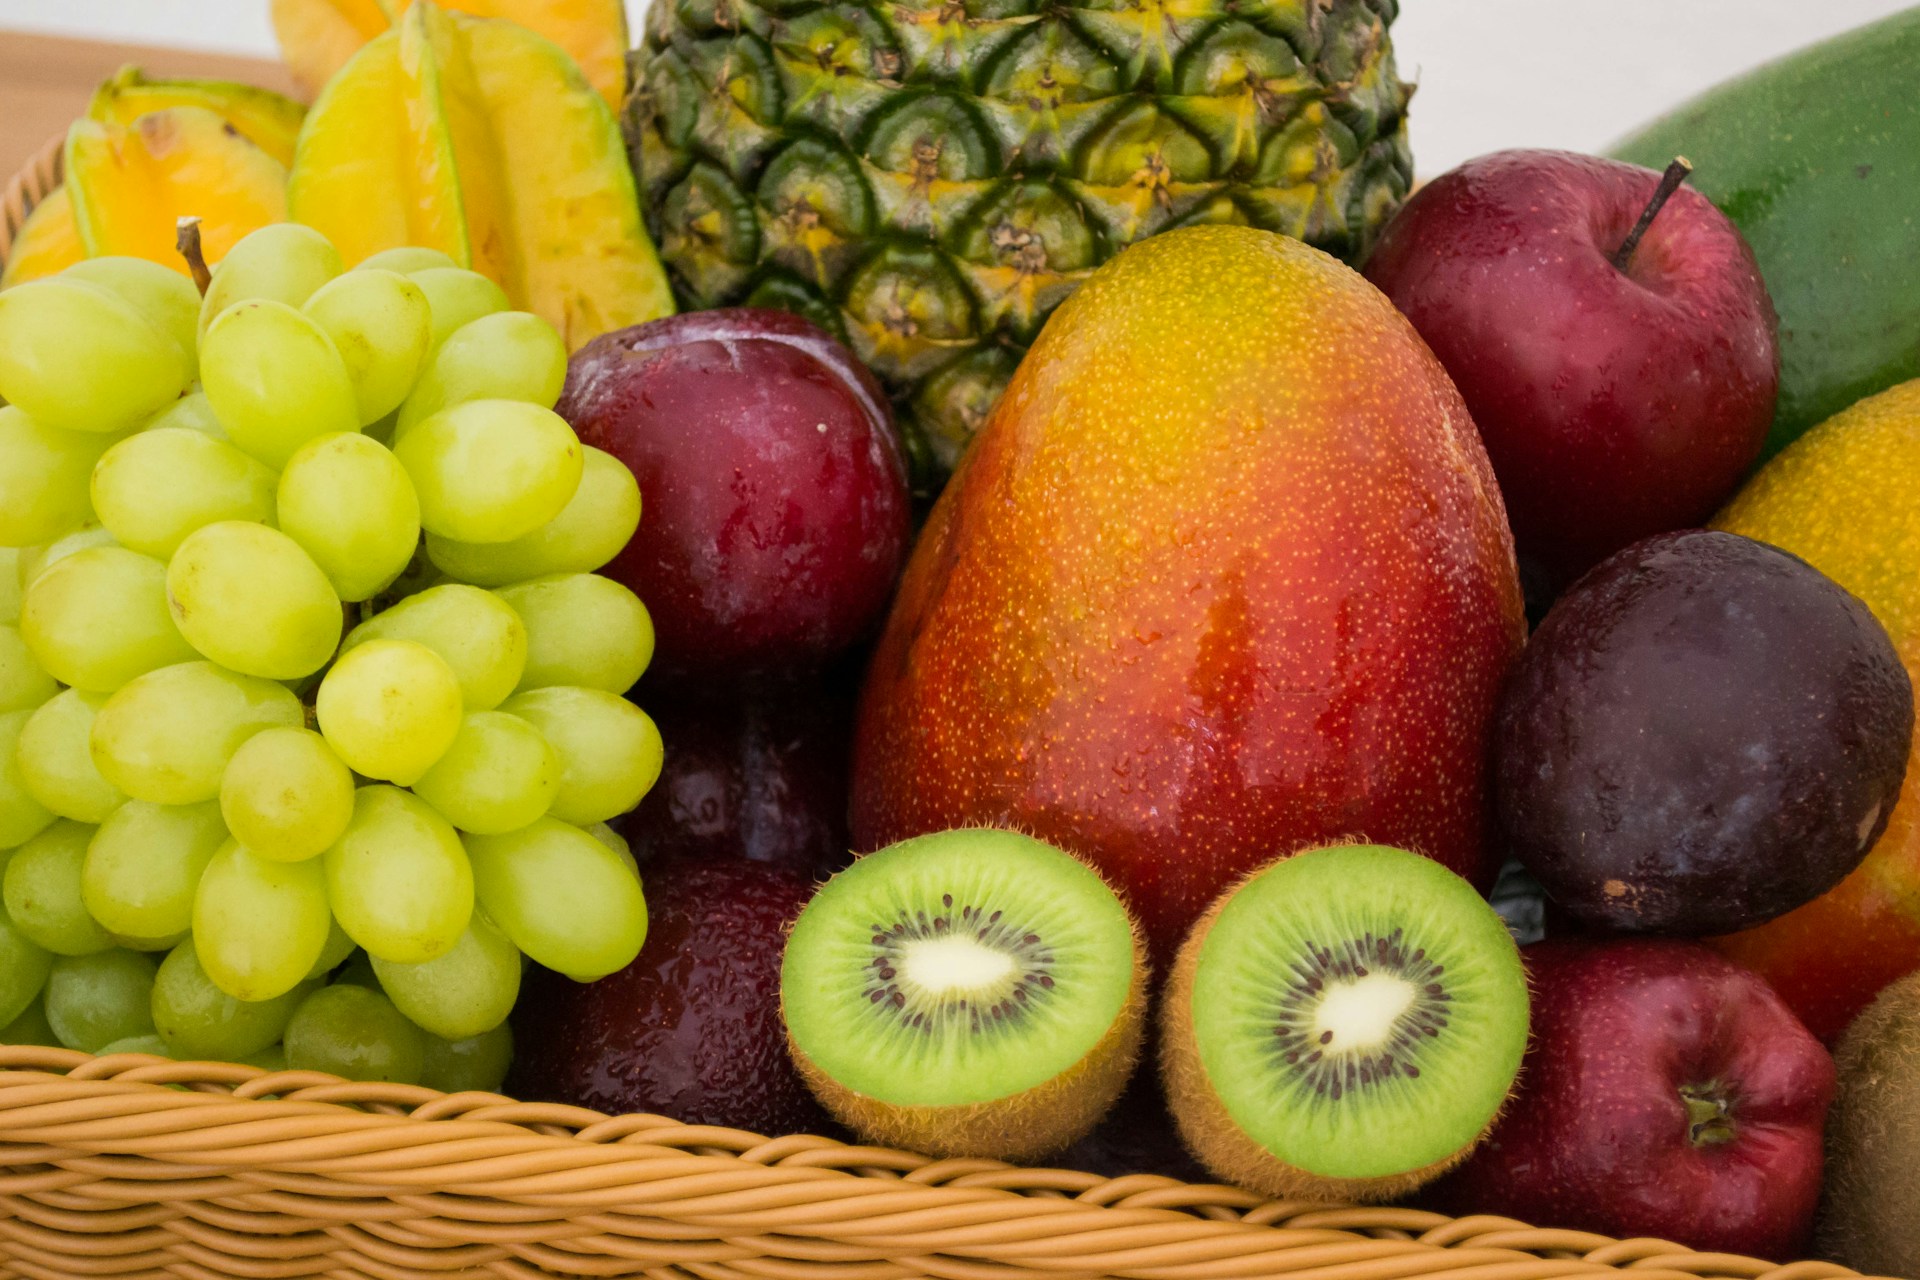
Photo by Jonas Kakaroto on Unsplash.
The idea for this post was based on the K-means & Image Segmentation - Computerphile video.
If this resonated with you, hit that heart! It makes my day